The Same Social Ads Ranked #1 in Success and #2 in Failure. What a 739-Person Survey Revealed About the Real Tipping Point.
WINDOM's 2026 web marketing survey found social ads topping both 'most successful tactics' at 23.0% and 'most failed tactics' at 16.7%. Two surveys, one clear answer: the divide isn't the tool — it's who runs it and how.
What you'll learn in this article
- The key point to grasp before reading the full article
- How the issue changes practical decisions after reading
- Which follow-up article is worth opening next

A survey published in January 2026 has been spreading quietly through web marketing circles.
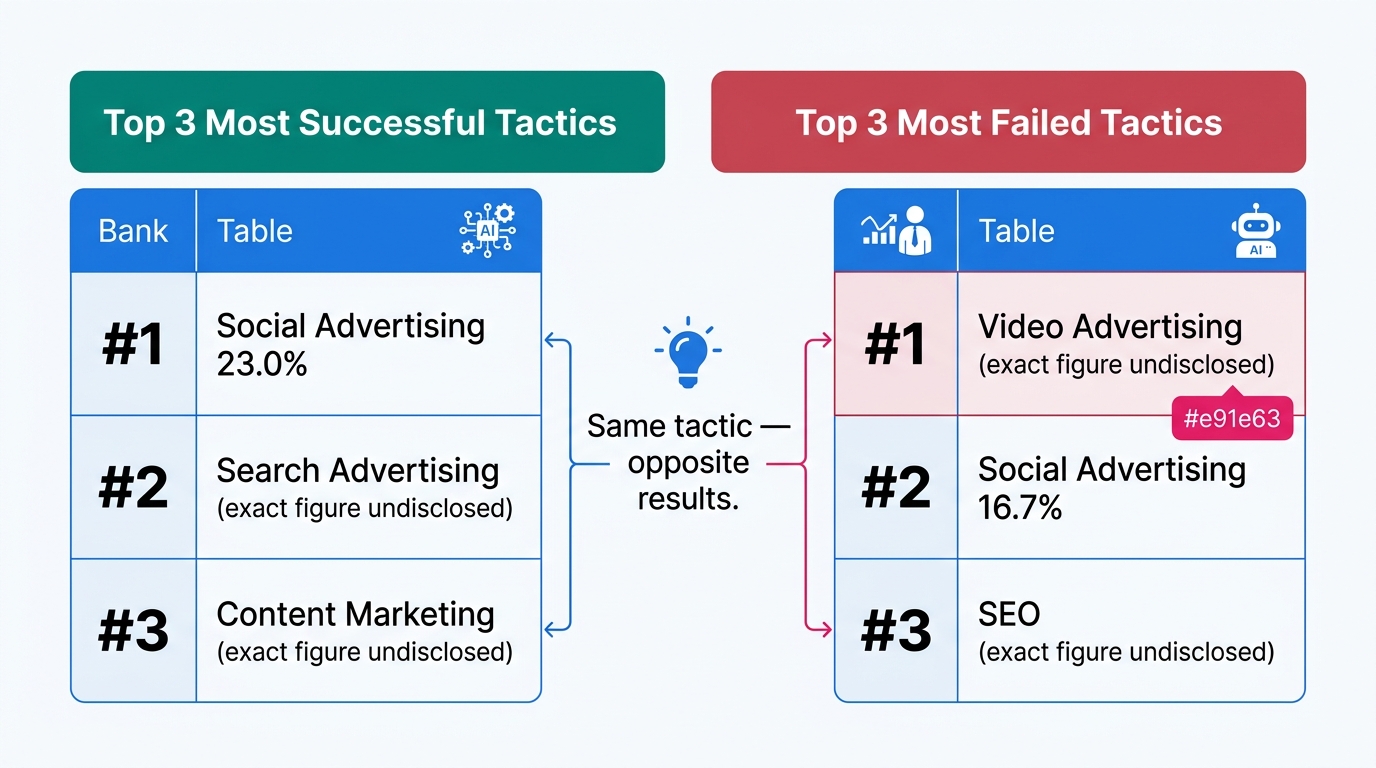
WINDOM Co., Ltd. surveyed 739 web marketing professionals with its “2026 Web Marketing Reality Survey.” The #1 answer for “most successful tactic” was social advertising, at 23.0%. But the same survey also listed social advertising — the exact same tactic — at #2 in “most failed tactics,” at 16.7%.
Same tactic. Success for some. Failure for others. At nearly comparable rates.
The survey title: “The Difference Between Companies Succeeding and Companies Floundering Is Now Clear.” Published via NEWSCAST on January 26, 2026.
The answer lies in “operations, not tools.” A second survey corroborated this with another layer of resolution. Today I’ll overlay the two datasets and design three questions that put you on the success side.
What It Means That Social Ads Ranked #1 in Success and #2 in Failure Simultaneously
Let’s look at the WINDOM numbers more specifically.
The top tactics ranked as “most successful” were: #1 social advertising at 23.0%, followed by search advertising, SEO, and content marketing. For “most failed tactics”: #1 was video advertising, #2 was social advertising at 16.7%, and #3 was SEO.
The same social advertising tactic gets a quarter of votes on the success side and a sixth on the failure side. This isn’t a contradiction.
Social advertising — Meta Ads, TikTok Ads — can now be launched by virtually anyone for a few thousand yen. Platform automated delivery has also matured. Fully automated delivery options like Meta Advantage+ and TikTok Smart Performance Campaign have become mainstream, lowering the barrier to entry. Lower barrier to entry means more people “try it.” A larger participant base means more people on both the success and failure sides show up in the data.
In other words, whether you succeed or fail isn’t determined by “whether you chose social advertising.” It’s determined by “how you ran it.”
WINDOM strongly implies the same point: results are determined by who runs it and how, not which advertising channel was selected. That’s the central finding of this survey, as I read it.
And within the same survey, there are figures showing “so what separates the success side from the failure side.” Let’s dig into that in the next section.
The Two Common Factors in Failing Companies
The WINDOM survey asked companies that didn’t see expected results: “What was the primary factor?”
#1: “Weakness in creative and messaging” at 20.3%. #2: “Strategic misalignment — gaps in targeting, value proposition, and positioning” at 18.5%. Source: WINDOM official blog (URL: https://windom-kk.co.jp/news/978/).
Combined, those two items account for approximately 38.8% — nearly 40% of failing companies stumbled not on the advertising channel but on content and direction.
“Weak creative” isn’t just about image or video quality. It means weak design at the level of “whose emotions, which pain point, which words.” The target was blurry; they built from off-the-shelf templates. This happens most commonly at companies that delegated entirely to outside agencies.
Strategic misalignment runs deeper. Value proposition (what exactly are we selling?), target (who are we selling it to?), positioning (where do we stand in the market?) — if these three aren’t aligned, no advertising works.
Here’s what I suspect: failing companies jumped into social advertising in a state where they had neither the time nor the people to build a strategy. There’s data from another survey supporting this structure.
PLAN-B conducted its “2026 Survey on SME Marketing Systems and Outsourcing” in 2025, targeting 200 marketing staff at SMEs (10–299 employees). Of marketing challenges, 42.0% cited “talent shortage” and 38.5% cited “insufficient strategic design.” Source: PR TIMES (URL: https://prtimes.jp/main/html/rd/p/000000385.000068228.html).
No people, no strategy. Decide in that state to “just run social ads for now” — and creative and strategy go sideways together. This is how the structure that ends up on the failure side gets built.
The 3 Things Companies on the Success Side Were Doing
So what topped the WINDOM survey’s “success factors”? This is the main point of this article.
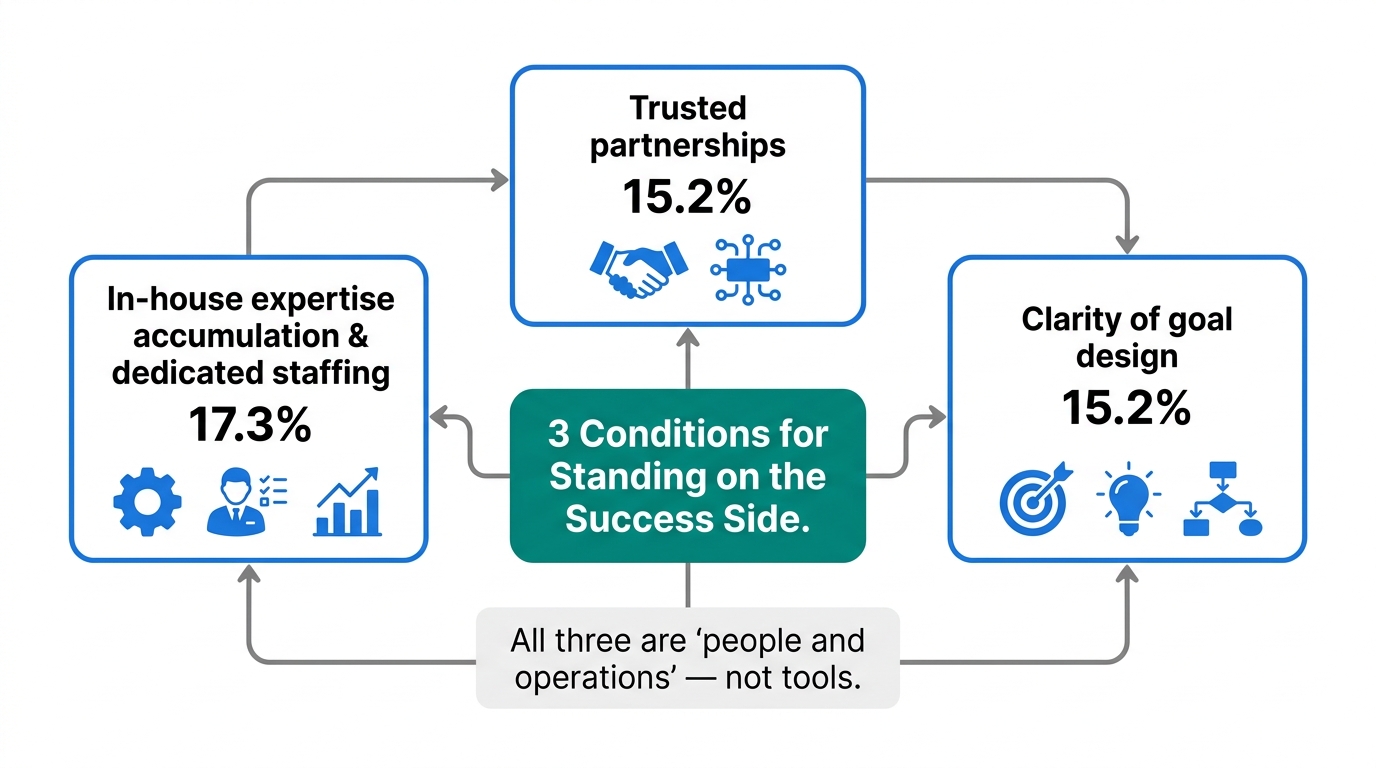
#1: “In-house expertise accumulation and dedicated staffing” at 17.3%. #2 tied: “Trusted partnerships” at 15.2%. #2 tied: “Clarity of goal design” at 15.2%.
Notice what’s not at the top: “a specific tool was superior” or “a specific agency was stronger.” The answers from successful companies were more unglamorous, more fundamental.
#1 “In-house expertise accumulation and dedicated staffing” rephrased: “there is at least one person at the company seriously watching web marketing.” Not a concurrent role, not delegated to outside parties — one person continuously running improvements. Obvious in theory, yet fewer than 40% of SMEs are actually doing it.
#2 “Trusted partnerships” is about the relationship with outside agencies. Not “chose them because they’re cheap” or “chose them because they’re famous.” They’re partnered with someone who understands the business and chases the numbers together.
#3 “Clarity of goal design” is the KPI and KGI question. Are you measuring by monthly lead count? By final LTV? The same social ads produce different plays depending on how you define what winning looks like.
What all three share: they’re all about “people and operations.” You don’t get results by buying a new tool. Who runs it and how determines the outcome.
The SME Reality — 38% Have a Dedicated Department, 20% Have No Marketing Staff
The #1 success factor is “in-house expertise accumulation and dedicated staffing.” So how many SMEs are actually doing it?
Back to the PLAN-B survey. Of 200 SME respondents, 38.0% had a “dedicated marketing department.” But 20.0% said they had “no marketing staff at all.”
That means one in five SMEs has no web marketing staff to speak of. A dedicated department exists at fewer than 40%. The remaining 40%+ are running things with either part-time dual-role staff or the business owner themselves juggling it alongside everything else.
The outsourcing data is also interesting. 35.5% “don’t use outsourcing at all.” Conversely, companies that do outsource tend to engage partners even at the upstream strategic design stage.
If you hold the fixed idea that “outsourcing is for getting people to do the work,” you’ll get left behind here. Successful companies engage partners earlier — at the strategy design stage. This connects directly to WINDOM’s “trusted partnerships” at 15.2%.
For dissatisfaction with outside providers: “Low feasibility of proposed approaches” at 26.0% and “insufficient business understanding” at 24.5% topped the list. “We get proposals, but our team can’t actually run them” and “they don’t understand our business” are the recurring complaints.
What this points to: “Hiring takes time. So find an outsourcing partner willing to work alongside us from the strategy stage” — this is a realistic path forward.
Going from zero to a dedicated department overnight is impossible for an SME. But “finding someone who will think through strategy with you” is something you could start this week.
3 Questions for Standing on the Success Side — A Self-Diagnosis Sheet
I’ve built three questions to apply the two surveys to your own web marketing. You can run through these in five minutes today.
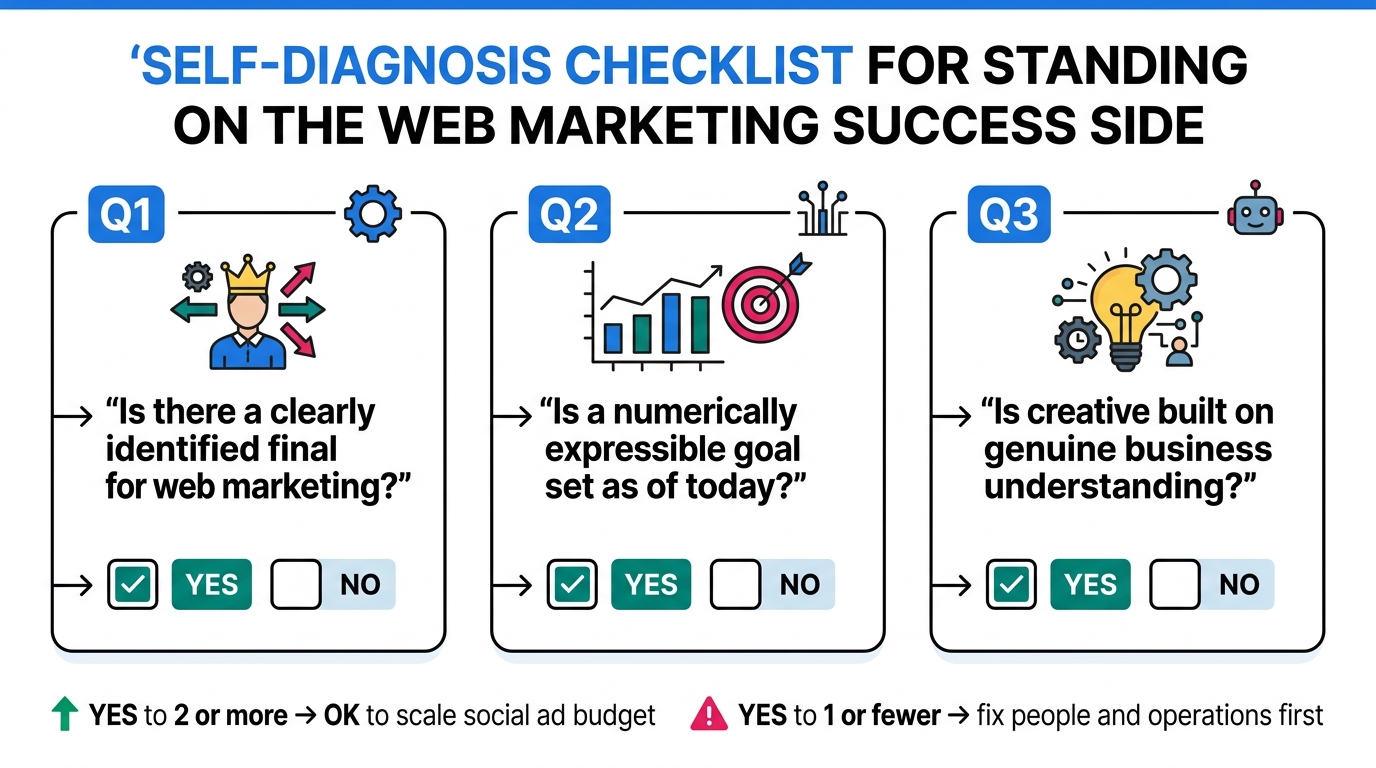
Question 1: Does your web marketing have a clearly identified “final decision-maker”?
“The owner vaguely keeps an eye on it” or “delegated to outside parties” — that’s not having a decision-maker. Someone who reviews the numbers every month, decides on tactics, and can make the call to stop something. Does your organization have one person like that? If no, start with role definition for whoever’s currently closest to the work.
Question 2: Is a “numerically expressible goal” set as of today?
“I want to improve brand awareness” and “I want to increase inquiries” are not goal design. 100 monthly leads, CPA under ¥8,000, average LTV ¥50,000. If numbers like these can’t be stated verbally right now, your goal design is in a weak state.
Question 3: Is your creative built on a genuine understanding of the business?
If you’re issuing briefs to external designers as “please make a nice image” — that’s weak. It comes down to whether you have a briefing sheet that puts into words which language your target customers respond to, which specific moment they feel their pain point. That document in hand — or not — makes the difference.
If you answer YES to two or more of these three: you’re standing at the entrance to the success side. If one or fewer: right now, it would produce results faster to rebuild your in-house “people and operations” before adding budget to social advertising.
From my own experience watching multiple teams over the years: in almost every case where ad budgets were increased without running through these three questions first, the money evaporated. Conversely, companies that got these three aligned before touching advertising reliably found traction within six months.
Why Only 1.6% Are Acting on AI Search Tactics — and the Trap Inside That Number
The WINDOM survey has one more number worth noting.
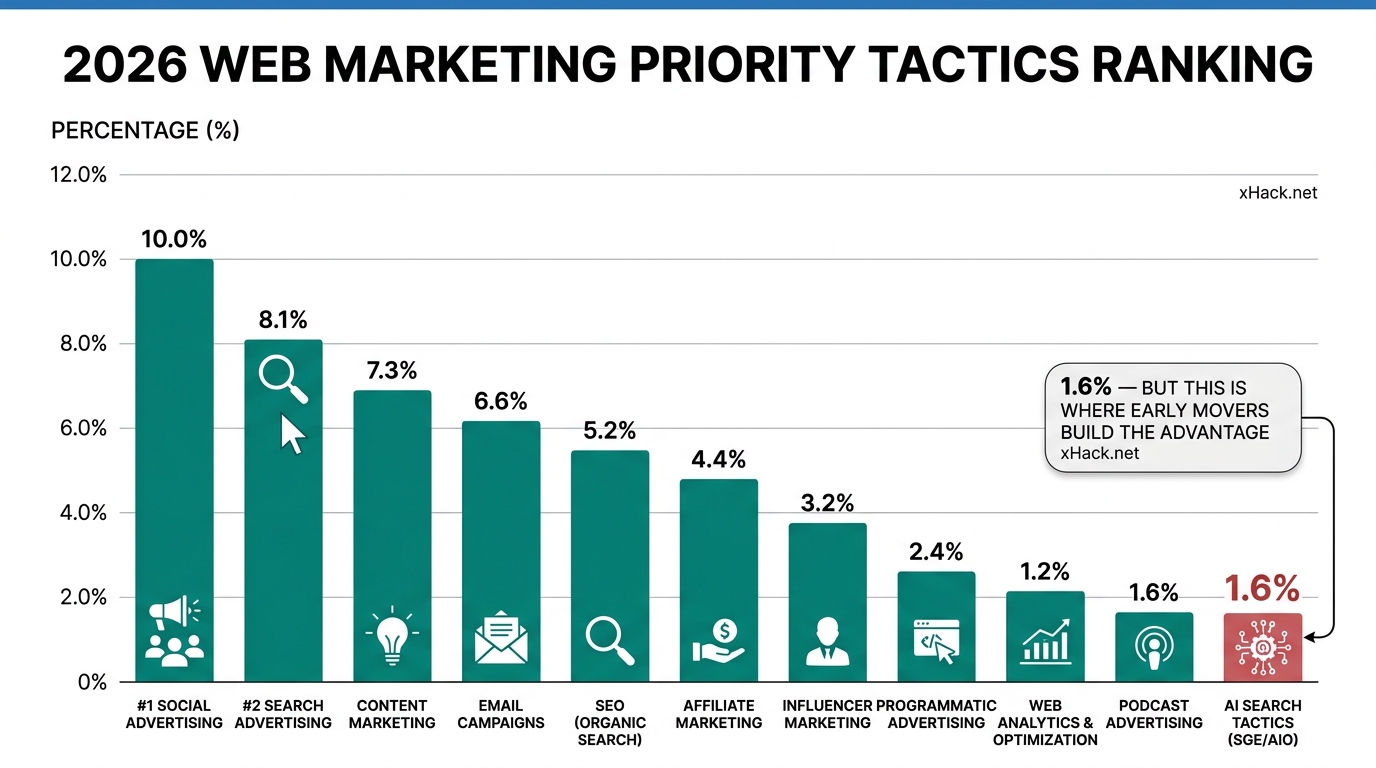
For “tactics to prioritize in 2026”: #1 social advertising at 10.0%, #2 search advertising at 8.1%. Traditional web advertising and SEO dominate investment intent. Meanwhile, AI search tactics (SGE, AIO — i.e., generative AI search and AI Overview optimization) sit at just 1.6%. The vast majority are still watching from the sidelines.
I read 1.6% as “slightly dangerous.”
Two reasons. First: Google’s AI Overview has already rolled out at scale, and the reality of AI-search-driven traffic is changing. Previsible’s analysis reported by Search Engine Land shows LLM-referred traffic up 527% year-over-year (2026). This is an observation from a specific sample of sites, not a universal figure applying equally to every industry and site type — but the directional signal is real.
Second: AI search optimization (GEO, AEO, LLMO) differs from SEO in that “results don’t show up in rankings even when you’re doing it right.” That invisibility is precisely why early movers get to build assets before competitors mobilize. If your plan is “wait until others start moving,” 2026 will be over by the time you catch up.
I covered the structural background in earlier pieces — organizing GEO, AEO, and LLMO into a single actionable framework and which tactics to prioritize after writing eight of them. If “AI search matters but keeps getting deprioritized” resonates with you, the difficulty of measuring effectiveness is the real cause.
That said: you don’t need to do everything. Adding “AI-citable structure” to even a portion of existing articles or landing pages starts compounding over a six-month window. This is a tactic you can begin with 10 hours per month. The fact that only 1.6% are doing it now is the opportunity.
Takeaway: 2026 Will Be Decided by Who Runs It and How
The structure the two surveys revealed:
- In WINDOM’s 2026 survey, social advertising ranked #1 in success and #2 in failure simultaneously. Same tactic — completely opposite results depending on how it’s run
- The top failure factors: “weakness in creative and messaging at 20.3%” and “strategic misalignment at 18.5%.” Companies stumble on content and direction, not the channel
- The #1 success factor: “in-house expertise accumulation and dedicated staffing at 17.3%.” Followed by “trusted partnerships at 15.2%” and “clarity of goal design at 15.2%”
- PLAN-B’s survey: 38.0% of SMEs have a dedicated marketing department; 20.0% have no marketing staff. Top challenge: talent shortage at 42.0%
- AI search tactics at 1.6%. The watch-and-wait crowd is overwhelming — but companies that move here will pull ahead next year
Rebuilding operations delivers faster results than swapping out tools.
Before testing a new ad platform, spend five minutes today running the three questions against your own organization. If you have two or more YESes, you’re in a position to scale social ad budget. One or fewer: fix people and operations first. Getting the order wrong means whether you end up on the success side or the failure side of “most successful” and “most failed” becomes a coin flip.
Companies on the success side are not choosing better tools. They’re choosing better operations.
For related reading: my single-page map of the 2026 marketing landscape for the big picture, and the honest 4-month report on Ahrefs Social Media Manager for a real-world example of “subtracting from your tool stack.” The first gives you the full view; the second gives you a concrete subtraction case study.
Sources
- WINDOM Co., Ltd. “2026 Web Marketing Reality Survey: ‘The Difference Between Companies Succeeding and Companies Floundering Is Now Clear’” NEWSCAST, January 26, 2026: https://newscast.jp/smart/news/8294122
- WINDOM Co., Ltd. official blog “2025 vs 2026 Web Marketing Survey — Successful Tactics and Failed Tactics — The Underlying Factors”: https://windom-kk.co.jp/news/978/
- WINDOM Co., Ltd. “2026 Web Marketing Investment Trends: Approximately 40% Remain Cautious on Budget Increases Due to Past Campaign Failures. Natural Search Optimization Draws Attention.” PR TIMES, 2026: https://prtimes.jp/main/html/rd/p/000000003.000176801.html
- PLAN-B Co., Ltd. “2026 Survey on SME Marketing Systems and Outsourcing” PR TIMES, 2026: https://prtimes.jp/main/html/rd/p/000000385.000068228.html
- Search Engine Land “AI traffic up, SEO rewritten” 2026 (Previsible analysis — source for 527% LLM-referred traffic figure): https://searchengineland.com/ai-traffic-up-seo-rewritten-459954

AIを使いこなせない方は、この先どんどん差がつきます。僕はAIエージェントを毎日動かして、壊して、直して、また動かしてます。そういう泥臭い実践の記録をここに書いてます。理論は他の方にお任せしました。僕は動くものを作ります。朝5時に起きてウォーキングしてからコードを書くのがルーティンです。